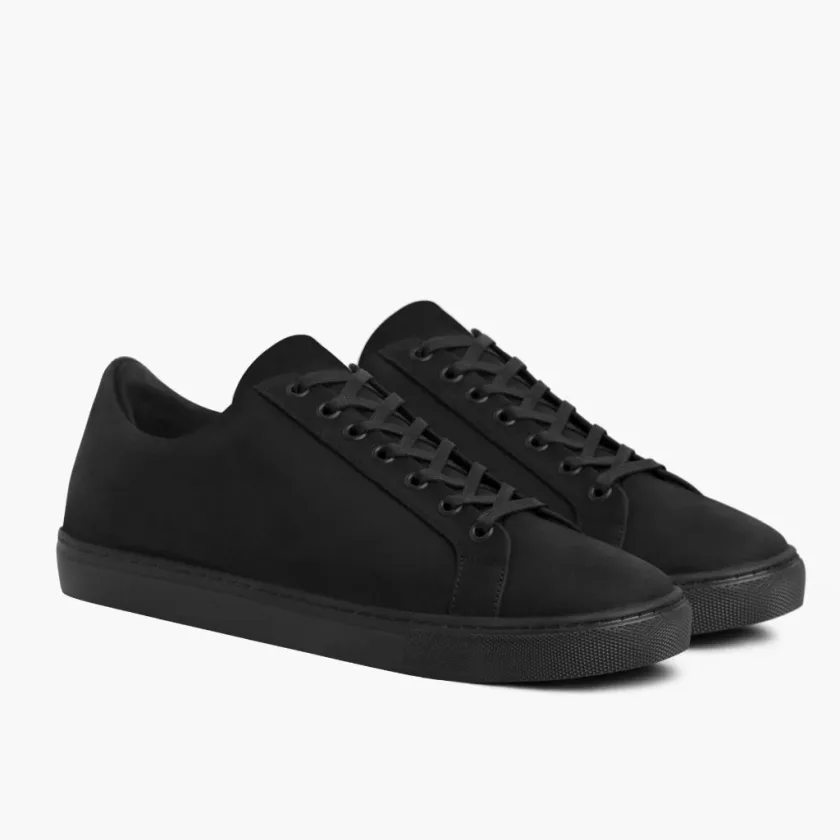
Thursday Boots Premier
$135 · price at the maker's store
$0.52or less / wear
No. 30 of 38 for cost per wear
2 owners have worn theirs a year or more · if worn 5 days a week
The wear machine / illustrative shoe, personal scenario
Scroll. The shoe moves. The cost of a wear falls.
Take it out of the box.
A reality check from our research
Minimal leather models from our current cost-per-wear ranking. Their figures describe reported wear under the published method.
$135 · price at the maker's store
No. 30 of 38 for cost per wear
2 owners have worn theirs a year or more · if worn 5 days a week
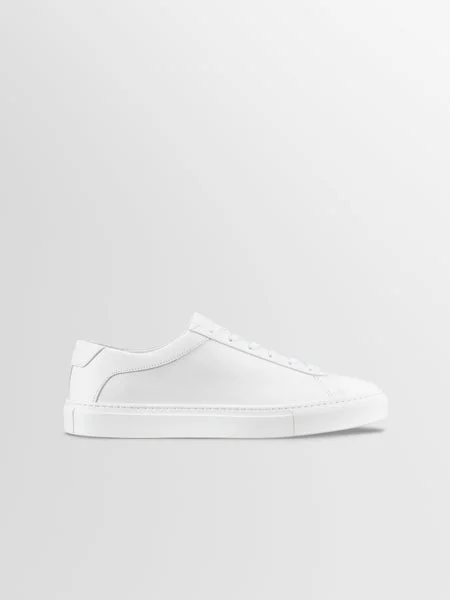
$265 · price at the maker's store
No. 29 of 38 for cost per wear
2 owners have worn theirs 2 years or more · if worn 5 days a week
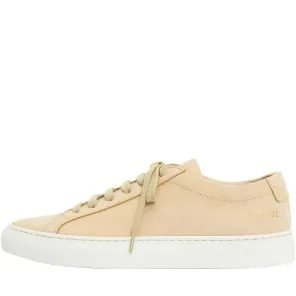
$565 · typical price at large US stores
No. 36 of 38 for cost per wear
3 owners have worn theirs 2 years or more · if worn 5 days a week
Reported years and wear frequency matter. These model-level figures are bounds under the published method, not a forecast of a newly purchased pair’s life.
Method cpw-v2, 2026-10-04. Cost per wear is the price we print for a pair divided by how many times it is worn: days a week × 52 × years. The years come from owners: at least 2 owners, one vote each, who have worn the pair a year or more — we take the time the second-longest of them has reached, at the low end of what they said (1, 2 or 4 years). Owners are still wearing most of these pairs, so each wear costs this or less. Where more owners say a pair came apart or wore out than have worn it that long, their experience differs and we print no figure. The days a week come from owners too when at least 2 of them say how often, every day counting as five; otherwise the figure is for 5 days a week, and the calculator on each model page lets you change it. We never divide a price that only AI guessed, nor an outlet’s or a reseller’s. The figure does not move a pair’s place in the Sneaker ranking.
Past use and completed use are different. “Or less” means the calculation is an upper bound from owners’ reported use; “or more” is a lower bound where pairs were reported to end early. Neither promises the lifetime of a new pair.
Versions and prices: these are model-level calculations. Each photograph shows one execution; the public calculation does not pair every owner’s original purchase price and version with that owner’s wear. Maker, maker-store and retailer prices are labelled separately. They are not a comparison of matched individual purchase histories.
Frequency: where the evidence does not support a frequency, the method uses five days a week as an explicit scenario. It is not measured frequency.
The examples stay separate from your personal assumptions. Read the published method.
Your personal scenario · illustrative shoes, no real model implied
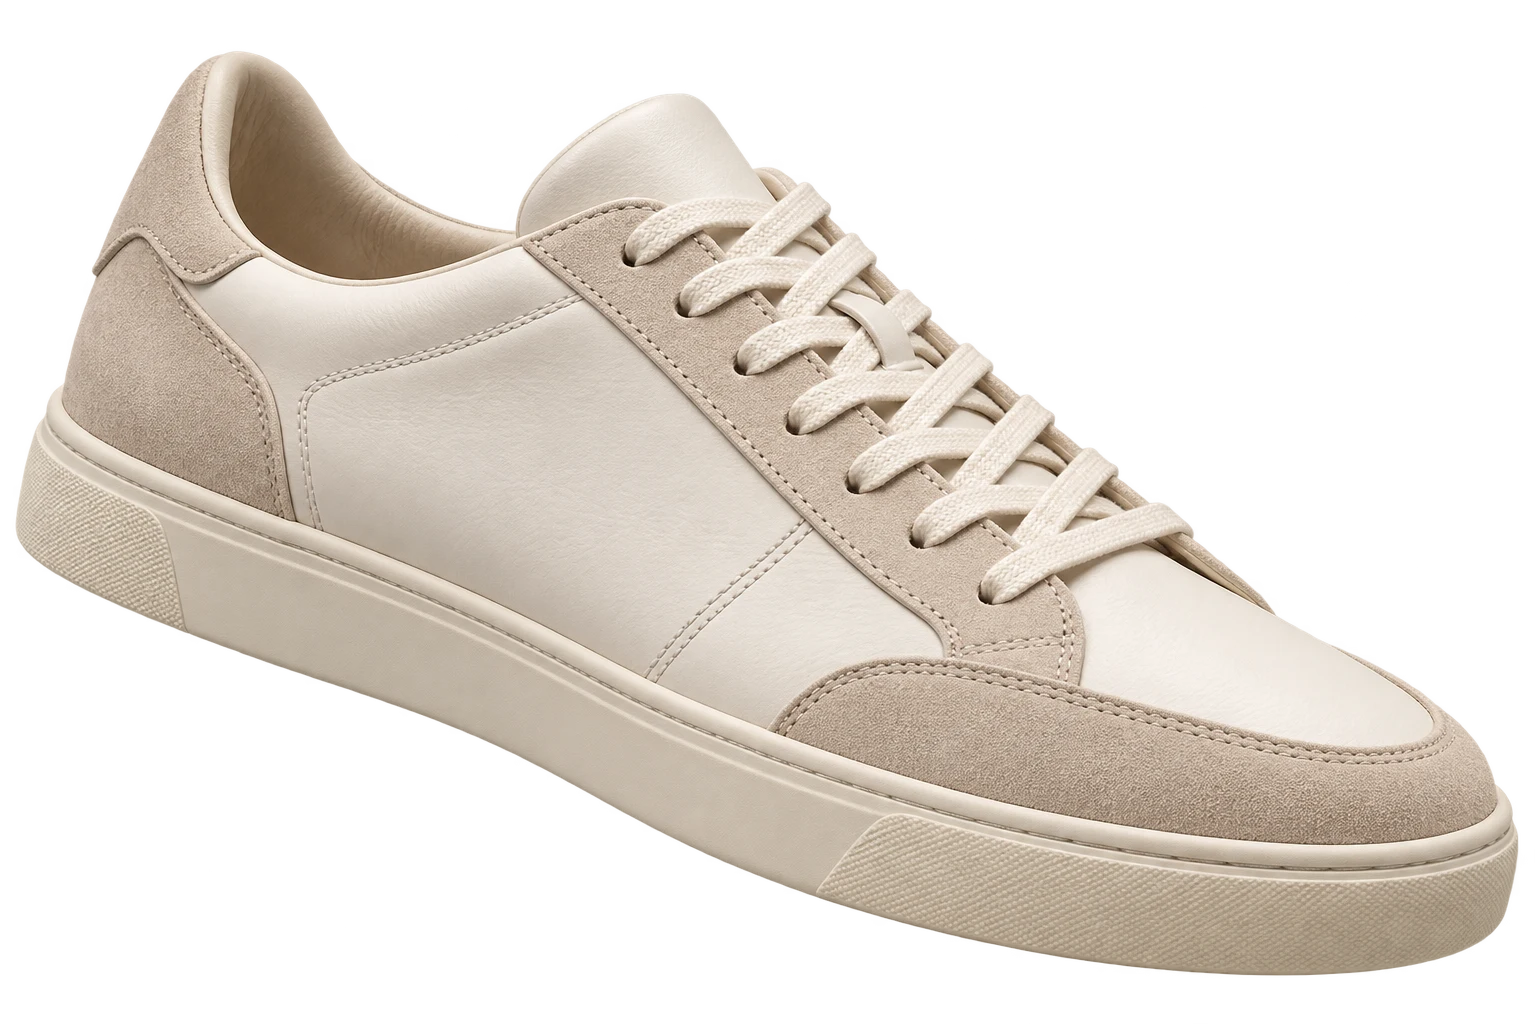
156 expected wears
468 expected wears
B costs twice as much at purchase. Spread each price over its expected wear.
Each dot = 2 expected wearsChange the life. Change the answer.
Start with a situation, then make it yours.
All prices and years here are assumptions.
One wear per day · 52 weeks per year · rounded up to the next cent. Expected years can mean when you stop using a pair, even if it is still wearable.
A walk through your assumptions
Move through B’s expected use.
Every outing spreads the same purchase price a little further.
B has crossed A’s planned cost per wear.
Your expected use, not a measured durability timeline. A’s reference cost is held fixed at the end of its own chosen plan.
The tipping point
312 wears would match A. At 3 days a week, B needs just over 2 years of use.
2× the purchase price needs more than 2× the wear.
Before you buy
The cheaper wear only happens if you reach that use. Check fit, comfort and your wardrobe before paying more.
Purchase price divided by expected wears. No repairs, care, resale value or discounting. These are two alternatives for the same job, each bought once. This compares their planned cost per wear; it does not model repeated replacement purchases or total spending over a shared time horizon.
The tipping point uses unrounded arithmetic. It fixes A’s chosen price and total wear, then finds the wear B needs to match it. A whole extra wear is required to be strictly cheaper. If both costs display the same cents, the underlying figures can still differ.
Expected use is your assumption, not a measured forecast of lifespan. Frequency and years are editable independently; the prototype does not assume that a pair lasts longer simply because it is worn less often.
The better buying question
Cost per wear helps you weigh a purchase.
Fit, comfort and a place in your life make it worth wearing.